Financial Advisors often segment their books of business and develop client service models for each segment. Each segment has a different number of touch points, such as phone calls, emails, newsletters, events, or meetings. In order to deliver the appropriate service level for each client, it’s essential to track all of the financial advisor’s activities. By consolidating these interactions into user-friendly metrics, we’ve made it easier for advisors to make the most of their time.

A consultant at ShellBlack developed an Activity Metrics section that tracks advisor interactions with clients.
Some of the many items advisors can monitor include:
- How frequently advisors contact clients per month or per year
- Specific touch points being used
- The last activity date
- Number of days since the last activity
These metrics will be converted into reports and dashboards in Salesforce so advisors can see the information quickly and drive effective activity. You can easily see which clients have and haven’t been contacted — as well as which clients may be receiving more attention than their situation calls for. Sometimes advisors can spend too much time with clients who aren’t generating revenue and not enough time with their revenue-generating clients. These reports and dashboards help advisors understand, at a glance, how their time is being spent.

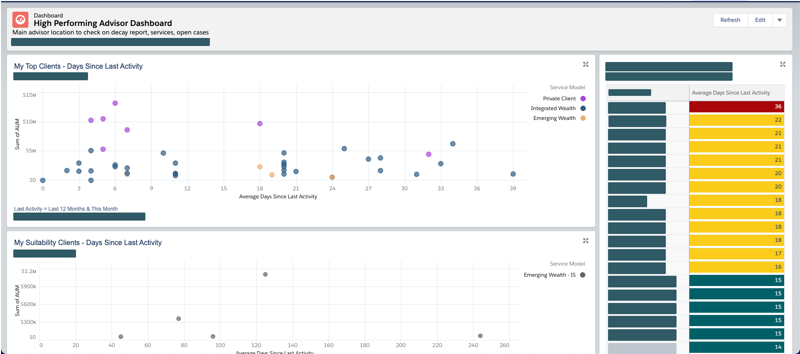
The advisor viewing this scatter plot dashboard will see their top clients charted by the number of days since they were last contacted. This dashboard is color-coded by service model segment, so you want all the purple dots on the left! Hover over each dot to get a pop-up with the client name, service model, average days since last activity, and sum of AUM.

Across the bottom of this dashboard are all the advisors in your firm. The dashboard shows whether advisors are retaining clients or losing them.

This dashboard is on the right of the picture above, with all the advisors’ names on the left and the average number of days since their last activity in a colorful bar.
This is a leaderboard you don’t want to be at the top of!
Advisors can bring these numbers down not only by contacting clients more frequently, but also by keeping track of these contacts and conversations. Many times, advisors are actually contacting their clients, but they aren’t entering those contacts into Salesforce to track them. These dashboards can drive positive changes that increase the accuracy of client data as advisors work to decrease their ranking on the leaderboard.
Another dashboard can show additional AUM gathered from existing clients. It can be interesting to watch how this dashboard changes as the advisors try to lower their number on the leaderboard above!
Tracking advisors’ interactions with clients is a great way to drive meaningful engagement and increase AUM. Any activity can be customized in Activity Metrics, then turned into a compelling dashboard to easily communicate the results to everyone.
This is just one way that a consultant at ShellBlack made it simple for a client to track Activity Metrics and help advisors work more efficiently. We can do the same for you! Contact ShellBlack today!
Author Credit:
Lisa Kilmer CFP© Salesforce Consultant at ShellBlack
Content Contributed by:
Brent Downey Directory of Delivery at ShellBlack